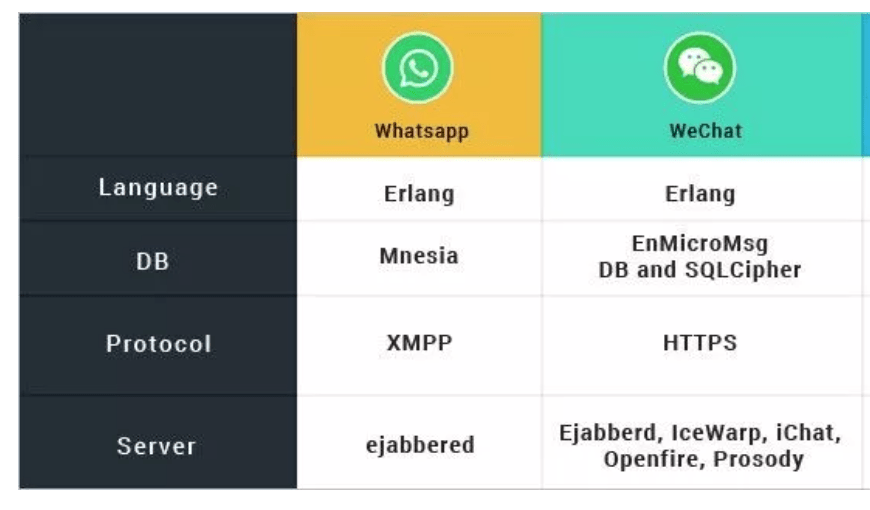
Among numerous modern programming languages, Erlang might not be in the spotlight. According to a recent survey, only 0.1% of websites currently use this server-side technology. However, it’s still one of the most potent languages for developing scalable soft real-time systems and robust servers. In particular, world-famous apps like WhatsApp and WeChat were built using Erlang.
So why does this programming language stand out? In particular, the reason is its scalable, concurrent ecosystem with many libraries and open-source Erlang tools.
We at Wellnuts have rich experience working with functional programming languages like Erlang and Elixir. In this post, we will explain Erlang’s benefits, its fundamental specifics, and the essential tracing tools.

What Is Erlang, and Where Is It Used?
Let’s start with the technology’s brief history to get a more holistic view of Erlang tools and use cases. The Ericsson Computer Sciences Lab created the Erlang programming language in 1986. Its core purpose was to handle and maintain telephone switching systems considered quite demanding in development, concurrency, and distribution. Thus, the language should have been capable of ensuring outstanding performance and preventing downtime.
And that’s why Erlang is still famous. This functional programming language is an excellent choice for large messaging systems that require great scalability and constant uptime. So far, some of the most successful Erlang use cases are WhatsApp, WeChat, projects by Nintendo, Vocalink, BT Mobile, Samsung, OpenX, etc.

As for the Erlang language’s specifics, it resembles Java in many ways. Both use a virtual machine to translate the hardware into a portable layer. For that, they employ independent byte code and run-time systems. Also, Erlang and Java support Multithreading, enabling developers to run multiple threads concurrently.
However, Erlang differs from Java in its essence. It’s a functional language, so its core goal is not to execute commands but evaluate expressions. Besides, Erlang is better suitable for embedded systems and servers, while Java focuses on building different kinds of apps.
Why Should You Use Erlang in Your Project?
As mentioned above, Erlang was created to develop high-scale, concurrent systems. Thus, this programming language offers significant benefits over other technologies in many aspects.
Concurrency Support
Writing concurrent computer programs in Erlang is easier. It is a functional programming language with a virtual machine that uses the so-called green threads (or green processes) and the actor model. The latter allows developers to write concurrent code in a way different from other languages, enhancing reliability. The green threads allow employing the actor model more widely. In particular, they foster the creation of complex actor systems.
Suitability for Scalable Systems
Most modern systems adhere to the principles of a distributed microservice architecture. And Erlang perfectly suits these standards. Erlang nodes can easily join Erlang clusters, which gives very fine control of any inside process. Thus, language is one of the best choices for distributed systems.
Reliable Bug Fixing and Tracing
Erlang’s supervisor system helps build programs that automatically restart and fix bugs. Besides, the technology involves several valuable tools for server debugging. In particular, these are redbug, recon, and the Erlang Observer graphical tool. These tools and tracing libraries can be even more effective than traditional Erlang development tools for debugging. And this post will explain them in more detail.
Erlang Ecosystem Tools
Erlang’s power has several core pillars, some of which are its rich libraries, resources, and tools. In this post, we will focus on tracing and debugging. However, before we dive deeper into this topic, let’s briefly outline the most effective tools for expanding Erlang’s capabilities.
Essential Erlang Tools
1. Erlang build tool
- Erlang offers several tools to manage your OTP apps, organize code, test it, and operate dependencies. In particular, these are erlang.mk and rebar3.
- erlang.mk supports all Erlang libraries, involves a plugin infrastructure for building a programming tool, and allows for many commands.

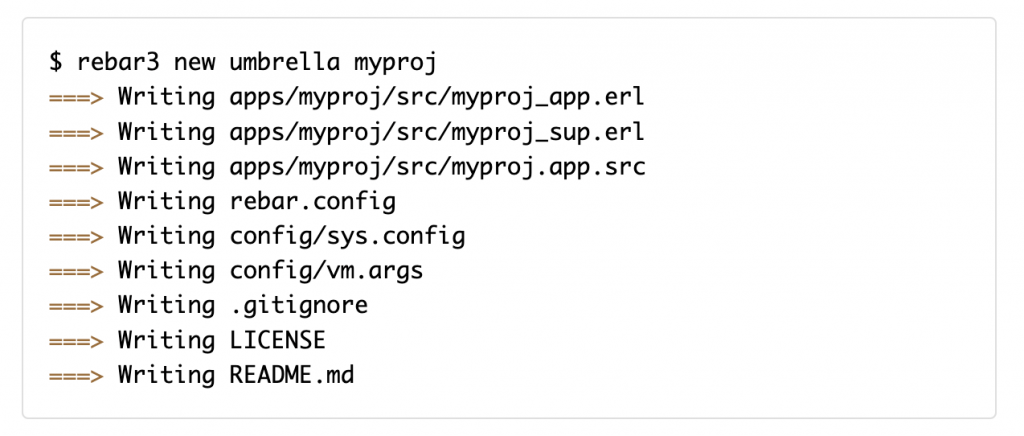
- rebar3 is an official Erlang build tool. With its help, you can run various commands to build an application, run tests, and generate releases. Also, you get access to multiple plugins enabling repeatable builds.

2. Erlang data anonymization tool
You can use multiple libraries and applications to secure data and follow high encryption standards. To name a few, these are erlang-jose, erlang-tpke, erlffx, etc.
3. Erlang monitoring tool
Erlang involves numerous libraries and tools for collecting metrics and monitoring. For example, these are eper, statsderl, entop, folsom, etc.
4. Erlang profiling tools
Profiling a computer program allows software developers to understand its performance bottlenecks better. Erlang/OTP provides several helpful tools in this regard. These are fprof, eprof, cprof, dbg, and lcnt. They give information about subroutine, program time spent, execution counts, function calls length, and Run-Time System’s contention points. Also, with Erlang’s Benchmark, you can learn the fastest way to implement a specific function or algorithm.
5. Erlang testing tools
- Several Erlang tools will help you ensure the code quality. In particular, these are dialyzer, xref, and elvis.
- dialyzer helps with static analytics and allows for detecting code inconsistency.
- xref is a programming tool for identifying small bugs like calls to a non-existent function.
- elvis is beneficial for code maintenance. You can set certain parameters in your elvis.config file and check your code’s compliance with those settings. If some of the rules are broken, the code will look as follows:

Erlang Tracing Library and Debugging Tools
Now, having introduced the essential Erlang tools used for different purposes, let’s look at Erlang process tracing.
Erlang offers traditional debugging methods where the execution stops to compile the modules you have to debug. The debugger:start(). command launches the debugging process in the Erlang shell. There, you can access the Erlang GUI tools and source code to perform all basic changes in the module. However, this traditional debugger involves certain limitations and, due to Erlang’s concurrent nature, may cause some unexpected crashes when pausing the execution process.
In contrast, Erlang tracing methods are much more flexible and convenient than breakpoint debugging. Their most significant advantages are:
- Unstoppable execution processes.
- Data collected from many processes simultaneously.
- No less information than traditional debugging.
Most tracing options in Erlang are based on erlang:trace/3 function. Alternatively, you can turn to the megaco app that allows multiple tracing options. With Erlang megaco tracing, you can enable, disable, and set trace when required.
However, you can also use other open-source tools and tracing libraries. Here, we will list and explain them in more detail.
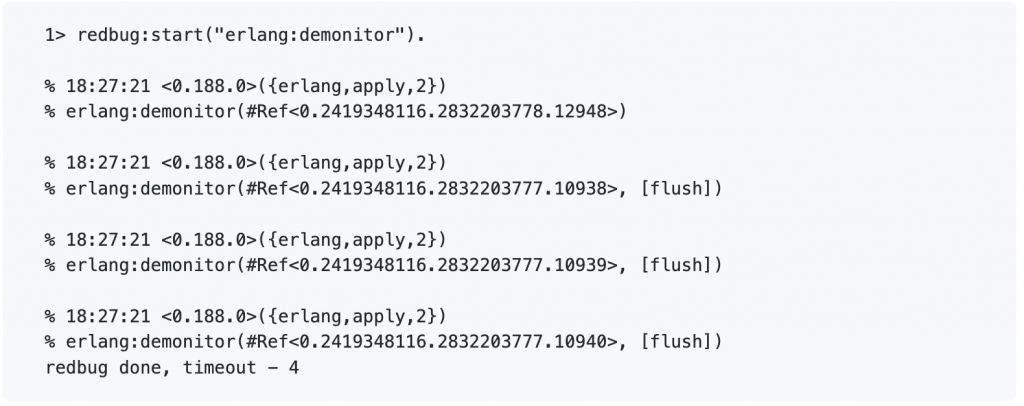
redbug
redbug is an Erlang tool that interacts with its tracing functions. This debugging application works similarly to dbg yet has additional safety features and a more convenient interface. redbug always uses a secured feature set and automatically stops the tracing process to prevent overloading. With this tool, you can set out a trace pattern as a string, and redbug will send a message to your console once a function call matches that pattern.

recon
recon is an open-source Erlang tracing library that can detect and diagnose production challenges in Erlang systems. It contains a handy recon trace module that supports tracing function calls safely and conveniently. Many agree that recon has a much more intuitive and straightforward interface than dbg and erlang:trace/3. Also, it involves better readability, high-level protection, and suitable formatting.
Additionally, recon allows for recovering the source code of compiled modules, testing memory consumption, managing queue length of commit messages, and detecting data leaks. All these features make recon an indispensable set of tracing tools for testing your server’s health.

Erlang Observer
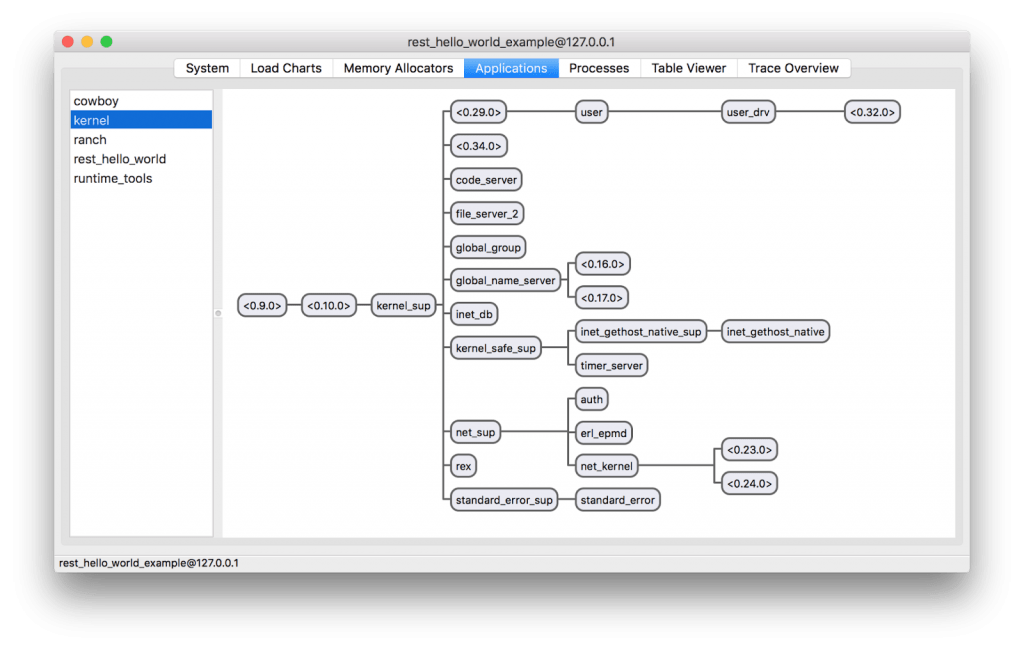
Erlang remote observer is a GUI tool connecting remote nodes and displaying various important information. Erlang trace function calls Observer to report about the system you’re running. In particular, the Observer Erlang informs about application supervisor trees, process information, ETS and Mnesia tables, and process information. The Observer also provides the front-end for Erlang tracing processes.
Here is how remote observer Erlang looks like:

Erlang Tracing Tools: The Bottom Line
Erlang is an excellent choice if you need to develop scalable, concurrent, and reliable computer programs. With its rich set of libraries, design principles, and tools, Erlang/OTP will greatly benefit projects related to telecommunications, banking systems, and messaging apps. The success of world-famous products like WhatsApp and WeChat has proven Erlang’s effectiveness.
In this article, we focused on explaining Erlang ecosystem tools’ value for tracing and debugging. Hopefully, our insights will help you make the most out of those libraries and techniques.
However, if you still have questions regarding an Erlang tool or other capabilities, our experts will gladly help you. We at Wellnuts have well-established expertise in various technologies, delivering scalable data-driven solutions. In particular, our development team works with Erlang, Elixir, and many other robust backend languages and frameworks.
Contact us, share your project details, and our experts will provide you with a detailed consultation!
Ready to talk? Contact us: ask@wellnutscorp.com


